
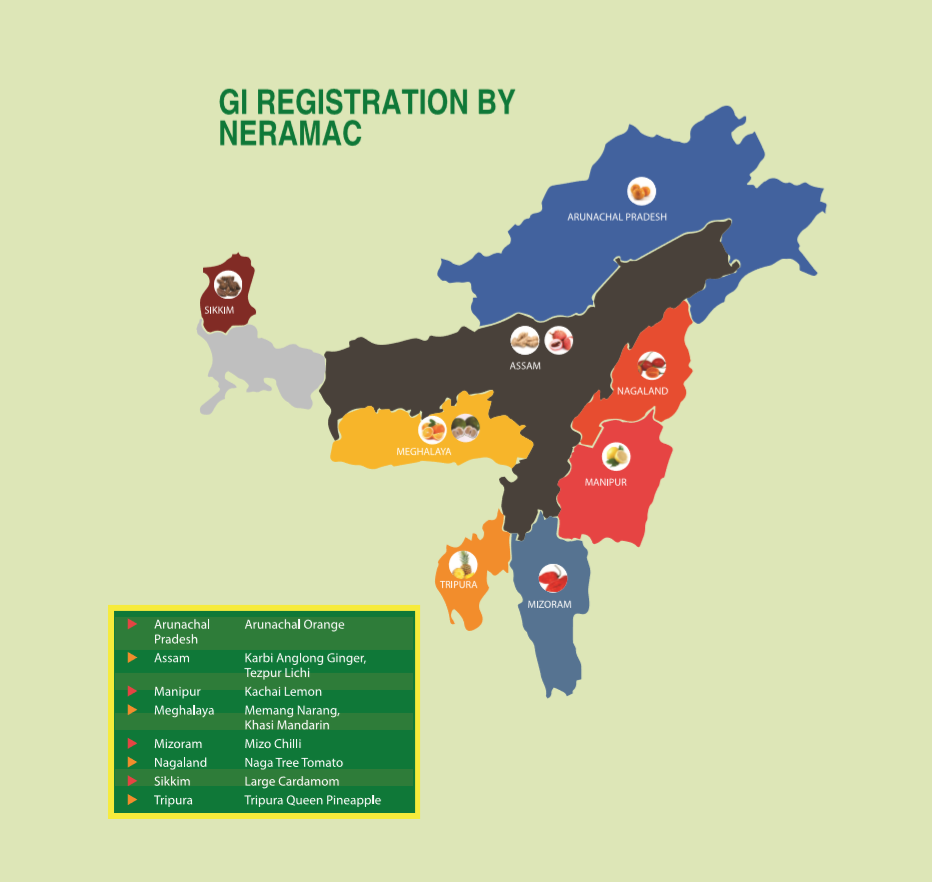
NE Agricultural Map
Area and production of individual fruits/vegetables (Arunachal Pradesh)
| Fruits/Vegetables | Area ('000 ha) | Production ('000 MT) | Percentage | |
|---|---|---|---|---|
| Area | Production | |||
| Other Citrus | 40 | 190 | 0.444 | 0.573 |
| Pineapple | 13 | 70 | 0.144 | 0.211 |
| Apple | 14.5 | 32 | 0.161 | 0.097 |
| Banana | 6.5 | 20 | 0.072 | 0.06 |
| Kiwi | 4 | 4.8 | 0.044 | 0.014 |
| Walnut | 5 | 0.6 | 0.056 | 0.002 |
| Other Fruits | 7 | 14 | 0.078 | 0.042 |
| Tomato | 0.5 | 14 | 0.294 | 0.341 |
| Cabbage | 0.5 | 12 | 0.294 | 0.293 |
| Cauliflower | 0.3 | 10 | 0.176 | 0.244 |
| Other vegetables | 0.4 | 5 | 0.235 | 0.122 |
| Source: Department of Agriculture, Cooperation & Farmer's Welfare (Data for 2014-15) |
Area and production of individuals fruits/vegetables (Assam)
| Fruits/Vegetables | Area ('000 ha) | Production ('000 MT) | Percentage | |
|---|---|---|---|---|
| Area | Production | |||
| Banana | 51.28 | 865.67 | 0.353 | 0.426 |
| Pineapple | 16.01 | 281.27 | 0.11 | 0.139 |
| Mandarin | 15.76 | 202.38 | 0.109 | 0.1 |
| Jackfruit | 21.95 | 195.64 | 0.151 | 0.096 |
| Papaya | 7.42 | 148.86 | 0.051 | 0.073 |
| Lime/ Lemon | 13.07 | 104.53 | 0.09 | 0.05 |
| Guava | 4.23 | 84.52 | 0.029 | 0.042 |
| Litchi | 5.44 | 48.73 | 0.037 | 2.4 |
| Mango | 4.59 | 45.69 | 0.032 | 2.3 |
| Aola/ Gooseberry | 0.9 | 16.27 | 0.006 | 0.008 |
| Sweet Orange | 0.14 | 1.85 | 0.001 | 0.001 |
| Other fruits | 4.44 | 34.74 | 0.031 | 0.017 |
| Potato | 99.18 | 1706.04 | 0.343 | 0.382 |
| Cabbage | 32.2 | 673.35 | 0.111 | 0.151 |
| Cauliflower | 22.14 | 466.37 | 0.077 | 0.104 |
| Tomato | 17.82 | 418.03 | 0.062 | 0.094 |
| Brinjal | 17.32 | 286.41 | 0.06 | 0.064 |
| Radish | 17.52 | 273.71 | 0.061 | 0.061 |
| Okra/Ladyfinger | 11.87 | 185.72 | 0.041 | 0.042 |
| Cucumber | 6.72 | 71.99 | 0.023 | 0.016 |
| Carrot | 4.3 | 68.56 | 0.015 | 0.015 |
| BitterGourd | 5.32 | 50.96 | 0.018 | 0.011 |
| Bottle Gourd | 2.87 | 50.31 | 0.01 | 0.011 |
| Sweet Potato | 6.21 | 32.86 | 0.021 | 0.007 |
| Onion | 8.28 | 32.42 | 0.029 | 0.007 |
| Tapioca | 3.3 | 30.09 | 0.011 | 0.007 |
| Peas | 29.95 | 27.68 | 0.104 | 0.006 |
| Watermelon | 1.07 | 16.46 | 0.004 | 0.004 |
| Capsicum | 0.38 | 2.64 | 0.001 | 0.001 |
| Other vegetables | 2.81 | 76.14 | 0.01 | 0.017 |
Area and production of individual fruits/vegetables (Manipur)
| Fruits/Vegetables | Area ('000 ha) | Production ('000 MT) | Percentage | |
|---|---|---|---|---|
| Area | Production | |||
| Pineapple | 14.27 | 136.75 | 0.257 | 0.262 |
| Passion gruit | 9.27 | 99.16 | 0.167 | 0.19 |
| Banana | 6.99 | 94.22 | 0.126 | 0.181 |
| Lime/Lemon | 5.99 | 52.94 | 0.108 | 0.101 |
| Mandarin | 5.35 | 43.06 | 0.096 | 0.083 |
| Other fruits | 13.74 | 95.45 | 0.247 | 0.183 |
| Cabbage | 7.59 | 90.7 | 0.259 | 0.338 |
| Peas | 6.03 | 57.35 | 0.206 | 0.214 |
| Cauliflower | 2.85 | 31.34 | 0.097 | 0.117 |
| Tomato | 2.54 | 25.67 | 0.087 | 0.096 |
| Onion | 0.34 | 5.09 | 0.012 | 0.019 |
| Cucumber | 0.27 | 1.71 | 0.009 | 0.006 |
| Chillies( Green) | 0.19 | 1.43 | 0.006 | 0.005 |
| Okra/ Ladyfinger | 0.14 | 1.02 | 0.005 | 0.004 |
| Watermelon | 0.04 | 0.76 | 0.0001 | 0.003 |
| Other vegetables | 9.34 | 52.94 | 0.318 | 0.198 |
Area and production of individual fruits/vegetables (Meghalaya)
| Fruits/Vegetables | Area ('000 ha) | Production ('000 MT) | Percentage | |
|---|---|---|---|---|
| Area | Production | |||
| Pineapple | 11.59 | 124.6 | 0.319 | 0.33 |
| Banana | 7.06 | 88.7 | 0.194 | 0.235 |
| Mandarin | 8.78 | 42.23 | 0.242 | 0.112 |
| Papaya | 0.82 | 6.51 | 0.023 | 0.017 |
| Other Citrus | 2.16 | 6.35 | 0.059 | 0.017 |
| Lime / Lemon | 1.11 | 4.27 | 0.03 | 0.011 |
| Strawberry | 0.11 | 0.82 | 0.003 | 0.002 |
| Other Fruits | 4.7 | 103.76 | 0.129 | 0.275 |
| Potato | 18.8 | 191.5 | 0.422 | 0.359 |
| Cauliflower | 2 | 78.4 | 0.045 | 0.147 |
| Tomato | 2.2 | 52 | 0.049 | 0.097 |
| Cabbage | 1.9 | 40.7 | 0.043 | 0.076 |
| Tapioca | 5.6 | 34.4 | 0.126 | 0.064 |
| Radish | 1.5 | 28.7 | 0.034 | 0.054 |
| Carrot | 1.2 | 21.7 | 0.027 | 0.041 |
| Sitaphal/Pumpkin | 1.3 | 17.2 | 0.029 | 0.032 |
| Sweet Potato | 4.5 | 16.3 | 0.101 | 0.031 |
| Brinjal | 1 | 13.8 | 0.022 | 0.026 |
| Bottle Gourd | 0.7 | 8.4 | 0.016 | 0.016 |
| Beans | 0.9 | 6.4 | 0.02 | 0.012 |
| Peas | 0.9 | 5.9 | 0.02 | 0.011 |
| Bitter Gourd | 0.6 | 5.5 | 0.013 | 0.01 |
| Capsicum | 0.5 | 4.4 | 0.011 | 0.008 |
| Cucumber | 0.5 | 4.4 | 0.011 | 0.008 |
| Onion | 0.5 | 4.3 | 0.011 | 0.008 |
| Source: Department of Agriculture, Cooperation & Farmer's Welfare (Data for 2014-15) |
Area and production of individual fruits/vegetables (Nagaland)
| Fruits/Vegetables | Area ('000 ha) | Production ('000 MT) | Percentage | |
|---|---|---|---|---|
| Area | Production | |||
| Pineapple | 9.5 | 142.5 | 0.234 | 0.347 |
| Banana | 7.32 | 109.8 | 0.18 | 0.267 |
| Mandarin | 6.1 | 54.8 | 0.15 | 0.133 |
| Passion Fruit | 8.5 | 21.25 | 0.21 | 0.052 |
| Papaya | 1.36 | 16.32 | 0.034 | 0.04 |
| Lime/Lemon | 1.55 | 12.4 | 0.038 | 0.03 |
| Guava | 0.52 | 4.16 | 0.013 | 0.01 |
| Mango | 0.51 | 3.57 | 0.013 | 0.009 |
| Pear | 0.31 | 3.1 | 0.008 | 0.008 |
| Litchi | 0.46 | 3.22 | 0.011 | 0.008 |
| Plum | 0.46 | 3.22 | 0.011 | 0.008 |
| Aonla/Gooseberry | 0.27 | 2.91 | 0.007 | 0.007 |
| Peach | 0.34 | 2.72 | 0.008 | 0.007 |
| Kiwi | 0.2 | 2.4 | 0.005 | 0.006 |
| Sweet Orange | 0.26 | 2.08 | 0.006 | 0.005 |
| Jackfruit | 0.16 | 1.92 | 0.004 | 0.005 |
| Apple | 0.21 | 1.89 | 0.005 | 0.005 |
| Grapes | 0.19 | 1.14 | 0.005 | 0.003 |
| Pomegranate | 0.12 | 0.73 | 0.003 | 0.002 |
| Ber | 0.03 | 0.25 | 0.001 | 0.001 |
| Other Fruits | 2.19 | 20.62 | 0.054 | 0.05 |
| Cabbage | 8.1 | 162 | 0.21 | 0.329 |
| Tapioca | 6.15 | 92.25 | 0.16 | 0.187 |
| Potato | 4.82 | 65.1 | 0.125 | 0.132 |
| Chillies (Green) | 5.82 | 41.9 | 0.151 | 0.085 |
| Sweet Potato | 1.56 | 23.4 | 0.04 | 0.048 |
| Tomato | 2.72 | 20 | 0.071 | 0.041 |
| Beans | 2.33 | 18.65 | 0.06 | 0.038 |
| Peas | 1.56 | 9.36 | 0.04 | 0.019 |
| Onion | 0.7 | 7.7 | 0.018 | 0.016 |
| Carrot | 0.51 | 6.12 | 0.013 | 0.012 |
| Mushroom | - | 6.05 | - | 0.012 |
| Radish | 0.55 | 5.5 | 0.014 | 0.011 |
| Sitaphal/Pumpkin | 0.51 | 5.1 | 0.013 | 0.01 |
| Cauliflower | 0.62 | 4.96 | 0.016 | 0.01 |
| Cucumber | 0.46 | 4.6 | 0.012 | 0.009 |
| Brinjal | 0.41 | 3.28 | 0.011 | 0.007 |
| Watermelon | 0.18 | 1.8 | 0.005 | 0.004 |
| Okra/Ladyfinger | 0.16 | 1.28 | 0.004 | 0.003 |
| Bottle Gourd | 0.15 | 1.2 | 0.004 | 0.002 |
| Bitter Gourd | 0.14 | 1.12 | 0.004 | 0.002 |
| Other Vegetables | 1.1 | 11 | 0.029 | 0.022 |
| Source: Department of Agriculture, Cooperation & Farmer's Welfare (Data for 2014-15) |
Area and production of individual fruits/vegetables (Sikkim)
| Fruits/Vegetables | Area ('000 ha) | Production ('000 MT) | Percentage | |
|---|---|---|---|---|
| Area | Production | |||
| Mandarin | 10.28 | 16.86 | 0.643 | 0.7 |
| Banana | 1.63 | 3.89 | 0.102 | 0.161 |
| Papaya | 0.7 | 0.57 | 0.044 | 0.024 |
| Guava | 1.1 | 0.11 | 0.069 | 0.005 |
| Apple | 0.02 | 0.03 | 0.001 | 0.001 |
| Others Fruits | 2.27 | 2.64 | 0.142 | 0.11 |
| Potato | 10.24 | 49.87 | 0.351 | 0.383 |
| Peas | 2.02 | 9.27 | 0.069 | 0.071 |
| Tomato | 1.01 | 9.08 | 0.035 | 0.07 |
| Okra/Ladyfinger | 1.13 | 7.52 | 0.039 | 0.058 |
| Cabbage | 1.21 | 7.34 | 0.042 | 0.056 |
| Beans | 1.12 | 5.61 | 0.038 | 0.043 |
| Radish | 0.75 | 5.52 | 0.026 | 0.042 |
| Cauliflower | 0.78 | 4.23 | 0.027 | 0.033 |
| Carrot | 0.36 | 2.86 | 0.012 | 0.022 |
| Onion | 0.32 | 1.72 | 0.011 | 0.013 |
| Brinjal | 3 | 0.17 | 0.103 | 0.001 |
| Chillies (Green) | 0.09 | 0.32 | 0.003 | 0.002 |
| Bottle Gourd | 0.5 | 0.3 | 0.0172 | 0.002 |
| Cucumber | 0.07 | 0.3 | 0.002 | 0.002 |
| Bitter Gourd | 0.3 | 0.2 | 0.01 | 0.002 |
| Capsicum | 0.03 | 0.09 | 0.001 | 0.001 |
| Other Vegetables | 6.22 | 25.66 | 0.213 | 0.197 |
| Source: Department of Agriculture, Cooperation & Farmer's Welfare (Data for 2014-15) |
Area and production of individual fruits/vegetables (Tripura)
| Fruits/Vegetables | Area ('000 ha) | Production ('000 MT) | Percentage | |
|---|---|---|---|---|
| Area | Production | |||
| Jackfruit | 10.41 | 300 | 0.145 | 0.366 |
| Pineapple | 11.95 | 170.89 | 0.166 | 0.209 |
| Banana | 13.99 | 141.31 | 0.195 | 0.173 |
| Mango | 11.18 | 62.56 | 0.156 | 0.076 |
| Papaya | 3.72 | 37.25 | 0.052 | 0.045 |
| Mandarin | 6.7 | 36.52 | 0.093 | 0.045 |
| Lime/Lemon | 5.54 | 27.81 | 0.077 | 0.034 |
| Litchi | 3.92 | 20.58 | 0.055 | 0.025 |
| Guava | 1.22 | 6.3 | 0.017 | 0.008 |
| Sweet Orange | 1.21 | 1.81 | 0.017 | 0.002 |
| Sapota | 0.19 | 1.56 | 0.003 | 0.002 |
| Ber | 0.06 | 0 | 0.001 | 0 |
| Other Fruits | 1.67 | 12.54 | 0.023 | 0.015 |
| Potato | 9.04 | 159.47 | 0.186 | 0.197 |
| Cabbage | 3.28 | 86.19 | 0.067 | 0.106 |
| Radish | 3.24 | 62.46 | 0.067 | 0.077 |
| Cauliflower | 2.79 | 57.72 | 0.057 | 0.071 |
| Brinjal | 3.71 | 56.25 | 0.076 | 0.069 |
| Tomato | 1.83 | 44.03 | 0.038 | 0.054 |
| Bottle Gourd | 1.93 | 39.98 | 0.04 | 0.049 |
| Watermelon | 0.98 | 25.45 | 0.02 | 0.031 |
| Beans | 1.69 | 19.07 | 0.035 | 0.024 |
| Chillies (Green) | 2.38 | 18.55 | 0.049 | 0.023 |
| Cucumber | 1.63 | 16.97 | 0.034 | 0.021 |
| Okra/Ladyfinger | 1.73 | 16.73 | 0.036 | 0.021 |
| Sitaphal/Pumpkin | 0.84 | 16.72 | 0.017 | 0.021 |
| Bitter Gourd | 0.8 | 7.69 | 0.017 | 0.009 |
| Parwal/Pointed Gourd | 0.5 | 5.94 | 0.01 | 0.007 |
| Carrot | 0.37 | 4.46 | 0.008 | 0.005 |
| Onion | 0.38 | 2.59 | 0.008 | 0.003 |
| Peas | 0.46 | 1.77 | 0.009 | 0.002 |
| Elephant Foot Yum | 0.06 | 1.41 | 0.001 | 0.002 |
| Capsicum | 0.14 | 1.06 | 0.003 | 0.001 |
| Other Vegetables | 10.84 | 166.62 | 0.223 | 0.205 |
| Source: Department of Agriculture, Cooperation & Farmer's Welfare (Data for 2014-15) |